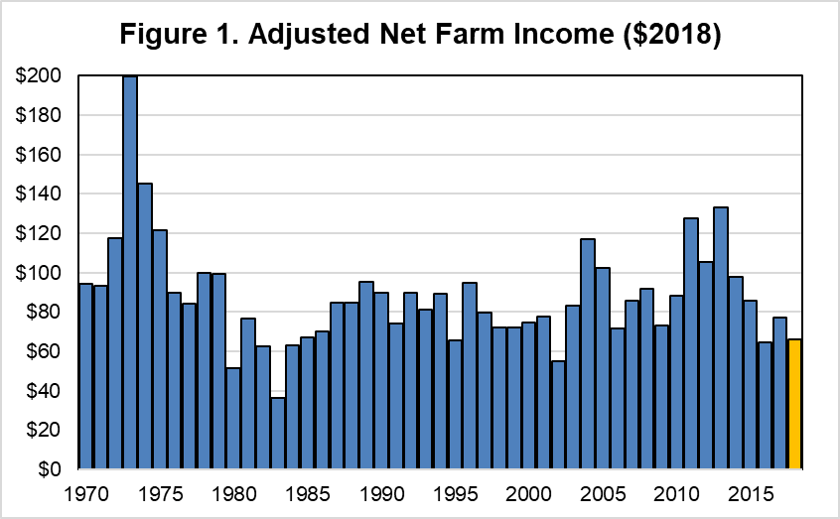
The USDA measures net farm income, which is a broad measure of profits for the farm economy and includes cash receipts, inventory changes, economic depreciation and gross imputed rental income of operator dwellings. Figure 1 (labeled Adjusted Net Farm Income) has been adjusted to include inflation so that a comparison across years can be made. Since 1970, only seven years have had lower incomes than 2018.
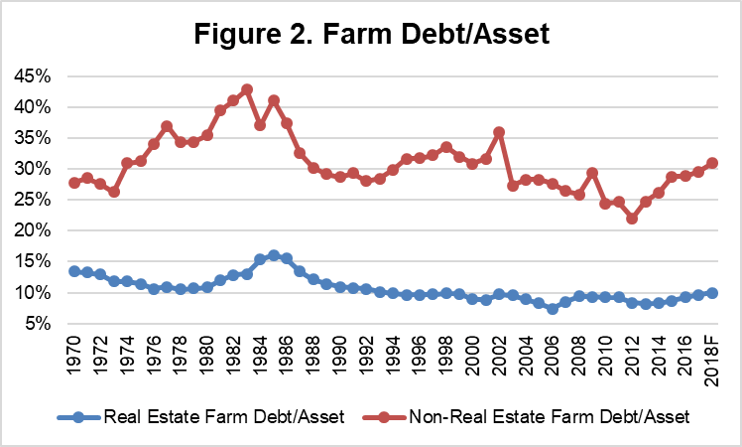
Another concern in the farm economy is farm debt to asset levels. Figure 2 (labeled Farm Debt/Assets) presents debt for real estate and non-real estate relative to their asset values. Most real estate has relatively low debt, but operations are generally leveraged. The figure shows non-real estate debt to assets hit a low in 2012 when commodity prices skyrocketed. Since then, debt relative to assets has increased for the sixth straight year.
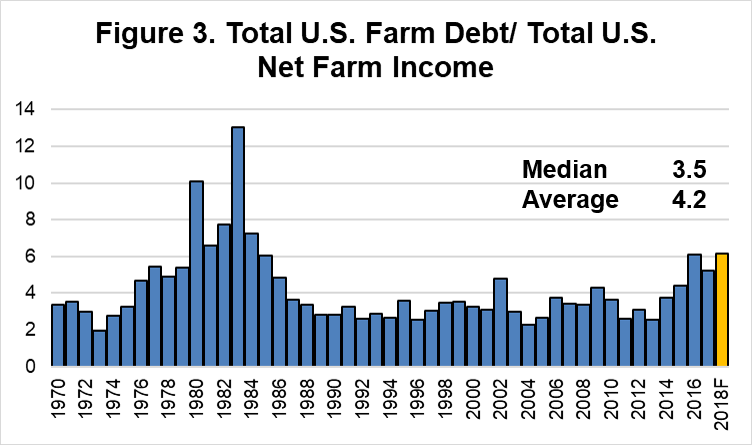
Figure 3 presents the Total U.S Farm Debt to Total U.S. Net Farm Income. On average, the ratio has been 4.2:1 but is currently around 6.2:1. When the ratio pushes above 4:1, the farm economy and land values begin to weaken as pointed out by Mike Walsten, LandOwner Newsletter editor for 45 years. The last time this ratio was greater than 6:1 was in the 1980s when the farm economy was significantly stressed. The last few years have seen stable land values, but if income does not improve relative to debt, we could see a decline in land values, although unlikely to the extent of the 1980s.